
This last week started with the conclusion of the Information Architecture of the Mapping Experiences. I could have an
overview of what I consider a complete service, and could from it determine the main screen types and start designing
the main patterns and sketching the interface.
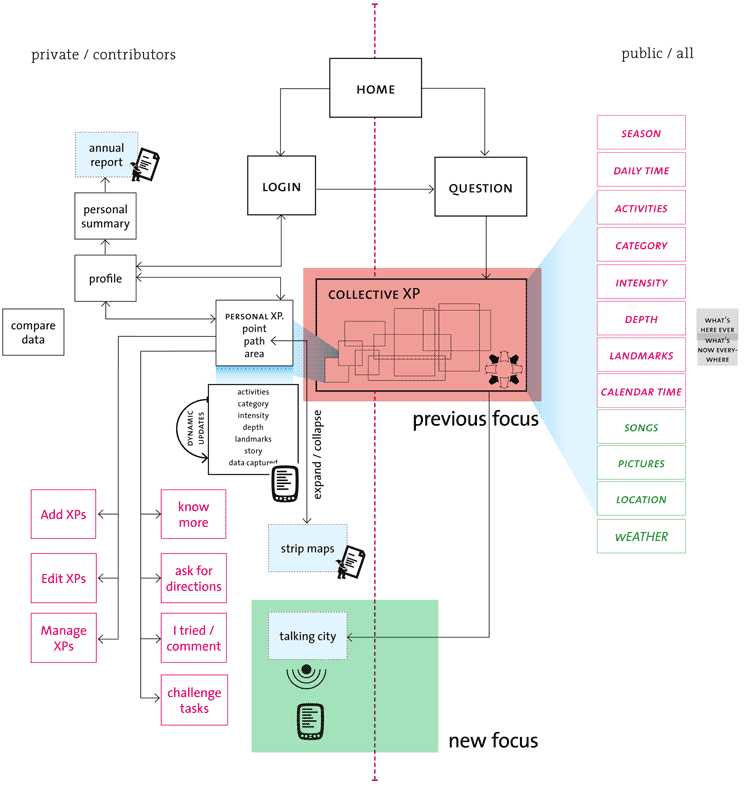
After the IA was ready, I started putting ideas on the paper and creating some sort of interface in order to verify
some ideas, see them realized or half realized and have some critical dialogue with them. This new approach was
very helpful for making me see what was only in my mind for so long, but also to show me that this was not what
I should be paying attention in the project.
This whole sequence of tagging and displaying content on a map has been done and is popping out in many ser-
vices through the web. The content focus is still a little bit different, but not enough to make an interesting project.
And also it deviates a bit from my original intent of taking the map out of the screen, and make the terrotory the map.
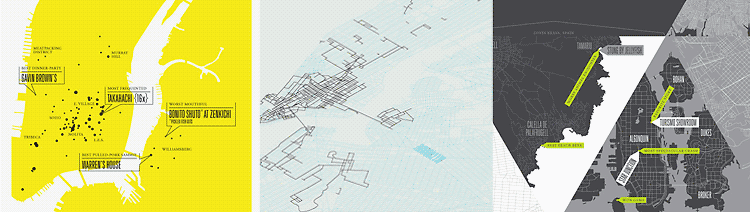
To sketch the interface I looked for inspiration in many sources, and a great compilation of works in Information Design
is the book Data Flow. I was also very inspired by the work of Nicolas Felton who offers his life data as annual reports
of himself in delightful posters [see image below]

Data Flow: Visualising Information in Graphic Design
Editors: R. Klanten, N. Bourquin, S. Ehmann, F. van Heerden, T. Tissot

LUST / RANDOM: www.lust.nl
Gerd Arntz WebArchive
Tokyo Tuesday: Japan, right now. | 東京の火曜日
DAYTUM
Feltron Eight
CYBU RICHLI
Simple Complexity
SARAH ILLENBERGER
C. Van Vleck | Information Taking Shape
catalogtree 4.0